

Statistics data of DiD
Representative domain (SCOP database)
- Domain list (download)
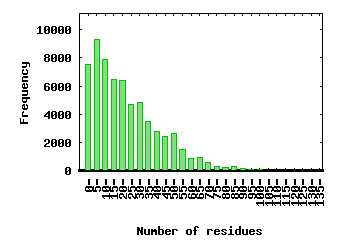
- Distribution of the interface area

- Distribution of the number of residues in the interface
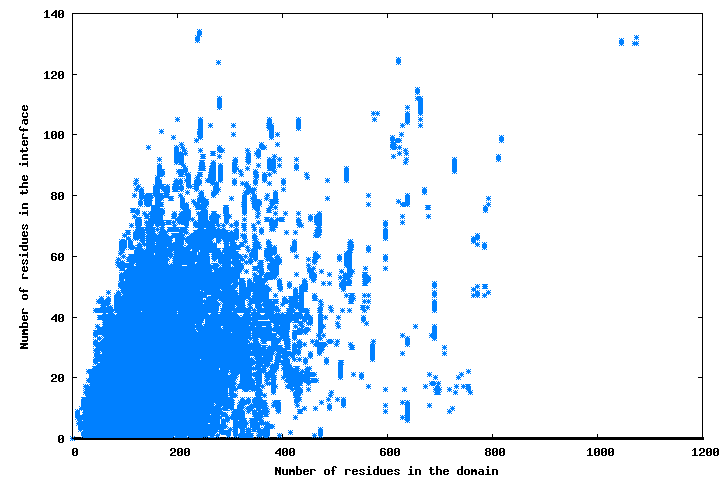
- Scatter plot of the number of residues (domain versus interface)
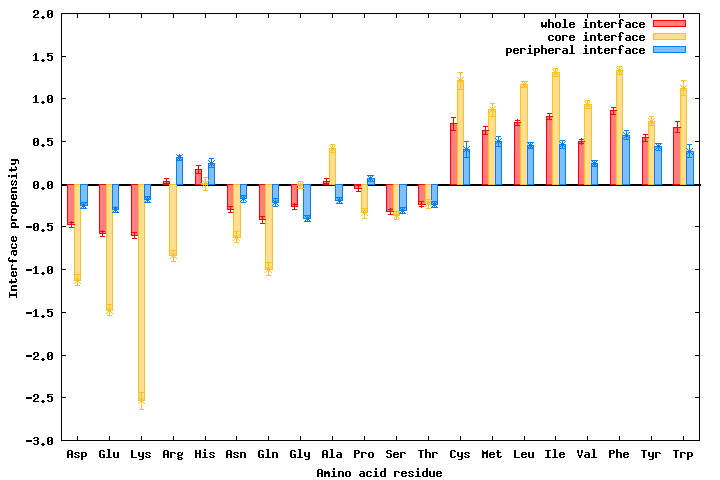
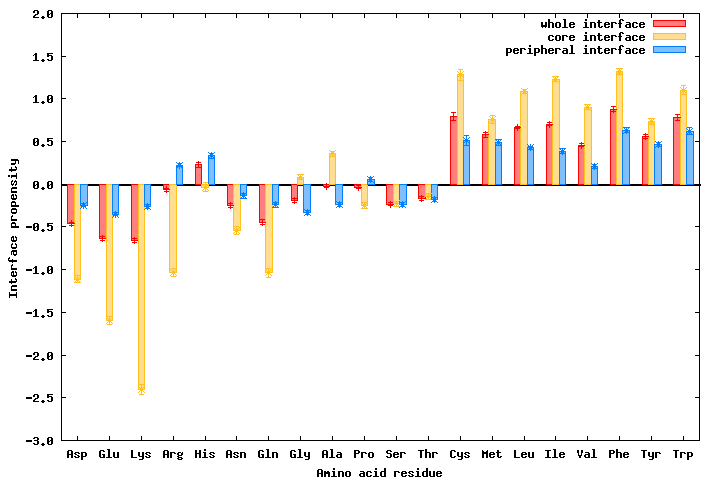
- Interface propensities of the amino acid residues (data)
Representative domain (CATH database)
- Domain list (download)
- Distribution of the interface area

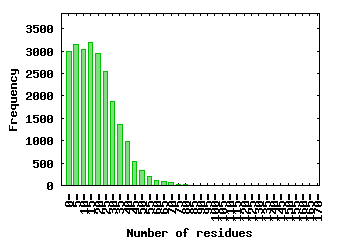
- Distribution of the number of residues in the interface
- Scatter plot of the number of residues (domain versus interface)

- Interface propensities of the amino acid residues (data)
Domain linker
- Scatter plot of the number of residues versus the length of domain linkers (SCOP database)

- Scatter plot of the number of residues versus the length of domain linkers (CATH database)
